Sales Analysis Worksheet 2
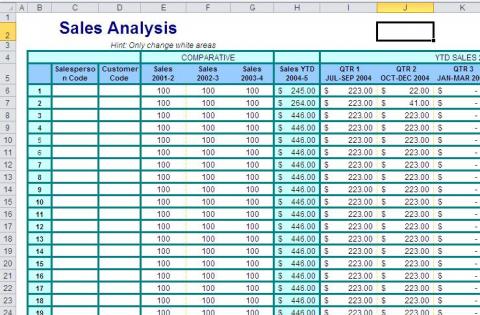
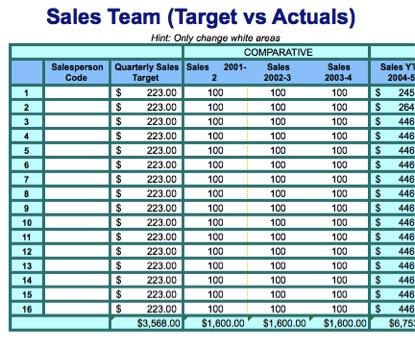
Simple sales team analysis worksheet analysing YTD sales figures for each team member by quarter and comparing them to quarterly targets and average quarterly figures over the last three years.
Document image:
AUD $3.30
Market analysis
Simple sales team analysis worksheet analysing YTD sales figures for each team member by quarter and comparing them to quarterly targets and average quarterly figures over the last three years.
High level. A Pre-MAP market survey containing strategic grouping. Split the market into groups of potential customers who are likely to act the same in given conditions
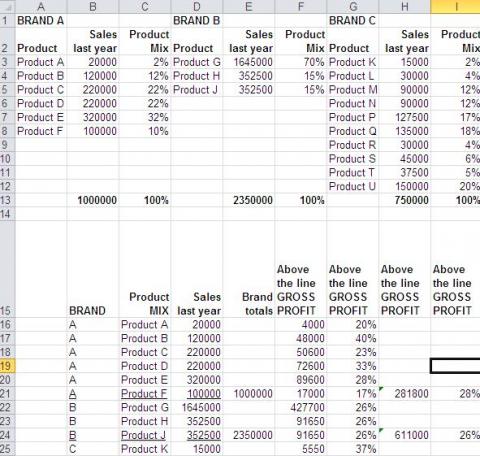
High level. This Excel spreadsheet contains an example of associated calculations for the simple report (M-1012) where the company's product mix is divided into market divisions such as 4 brands and 24 products and shows last year's market results including sales, COGS, ATL gross profits, and BTL contributions to net profits of each product. Useful when preparing for the marketing department's section of the corporate Annual Report or when preparing for a new marketing plan for a brand or product(s). International planning document.
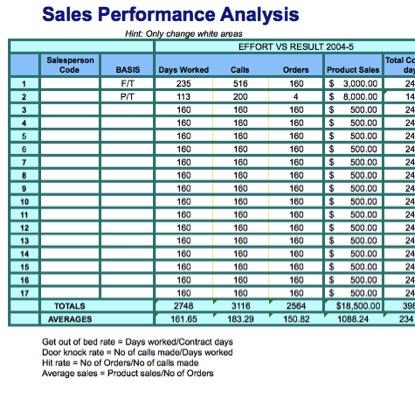
A detailed analysis of the reason for success of the sales team. A simple but powerful document. Includes 'get out of bed rates', 'door knock rates', 'hit rates' and 'average sales rates', which sounds like it would only be applicable to "door-to-door" salespersons but it actually can be used to analyse the performance of almost every sales team.
High level. In this simple report the company's product mix is divided into market divisions such as 4 brands and 24 products and shows last year's market results including sales, COGS, ATL gross profits, and BTL contributions to net profits of each product. Useful when preparing for the marketing department's section of the corporate Annual Report or when preparing for a new marketing plan for a brand or product(s). This document is associated with the Excel spreadsheet available at M-1011. International planning document.
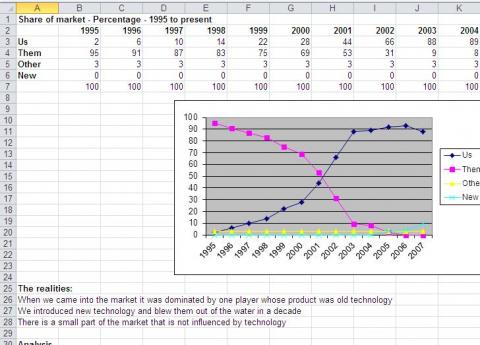
Excel spreadsheet. A simple explanatory example of a market in which there are are a number of players, in this example you can see where we got our share from. Includes simple numbers, a couple of examples of useful Chart representation of market share, year by year, and movement over time.

Excel spreadsheet. A simple explanatory example of a market in which there are only two main players, Us and Them, where Us have come on to the market and in a decade have taken over the market from Them. There is also a couple of minor players Other and New. Includes simple numbers, but realistic, when one company tends to dominate the market you could see an example just like this, and they are becoming more and more likely, a couple of examples of useful Chart representation of market share and a couple of possible problems and how to overcome them.
Two simple sales team analysis worksheets side-by-side, analysing yearly sales results by product split and regional split for each team member showing salesperson share percentage, regional split percentages and product split percentages.

Simple sales analysis worksheet analysing YTD sales figures by Customer by quarter and comparing them to average quarterly figures over the last three years.